This time I decided to write my blog in English, because this is a little bit deep s**t. I’m not describing how I created my machine learning project for predicting ice hockey results, because I have written about that in previous blogs, but I’m describing how I semi-automated the retraining process, which has to be done after every round.
First I needed those results and statistics from played games. I have described that process over here. In my training data I duplicate every game – one row for home team and one row for away team.

Meaningful data for predictions are: when game was played, team, against team, calculated goals, home or away game.
I use this R code to do duplication:
setwd("C:\\Users\\terok\\OneDrive\\Duuni\\PowerBI")

tuloksetOrig <- read.csv("LiigaMuokattu.csv", header=TRUE, sep=",", encoding="UTF-8")
tuloksetOrig <- transform(tuloksetOrig, OdotMaalitKoti = as.numeric(gsub(",", ".",OdotMaalitKoti)))

tuloksetOrig <- transform(tuloksetOrig, OdotMaalitVieras = as.numeric(gsub(",", ".",OdotMaalitVieras)))
tulokset2017 <- apply(tuloksetOrig, 1, function(row){

data.frame(Pvm = row['PVM'], joukkue=c(row['KJOUKKUE'], row['VJOUKKUE']),

vastus=c(row['VJOUKKUE'], row['KJOUKKUE']),

maalit=c(row['OdotMaalitKoti'], row['OdotMaalitVieras']),

voittaja=row['VOITTAJA'],

koti=c(1,0)

)

})
tulokset2017 <- do.call(rbind, tulokset2017)
tulokset2017$maalit <- as.character(tulokset2017$maalit)
tulokset2017$maalit <- as.numeric(tulokset2017$maalit)
tulokset2017$maalit[tulokset2017$maalit<0] <- 0
write.csv(tulokset2017, quote = FALSE, file="LiigaOdotMaalit.csv")
I can do that within Power BI using R script as a data source and refreshing that data source. Basically you can execute any R code within Power BI, but it needs to return a data frame. Sometimes I just create a dummy data frame to the end of the code, just to be able to execute my R code, which does something complete different, within Power BI.
Then I tried to follow the retraining process described at https://docs.microsoft.com/en-us/azure/machine-learning/studio/retrain-models-programmatically. I was able to do everything else using R, but deploying the retrained model back to cloud caused problems. Something seems to be missing from instructions, because I’m not the only one. Time wasted and lot of frustration.
Then luckily I found this solution: https://gallery.cortanaintelligence.com/Tutorial/No-code-Retraining-1. I created an Azure Logic App to do first the retraining and deployment of the new model in to use.
To be able to do the retraining within Azure, you need to copy your data into Azure cloud, namely into Azure Storage.

Storage account I already had, but I created new Blob Container for this. I tried to upload my file using my browser, but for some reason it didn’t work. As a workaround I found out I could use Powershell to do that after installing Azure components into my Powershell https://docs.microsoft.com/en-us/powershell/azure/install-azurerm-ps?view=azurermps-5.2.0.
I created a script, which uploads my file into storage:
Select-AzureRmProfile -Path "C:\Users\terok\OneDrive\Duuni\PowerBI\azureprofile.json"
$resourceGroup = "ML_Group"

$storageAccountName = "liigastorage"

$storageAccount = Get-AzureRmStorageAccount -ResourceGroupName $resourceGroup -Name $storageAccountName

$ctx = $storageAccount.Context

$containerName = "liigaretrain"
$localFileDirectory = "C:\Users\terok\OneDrive\Duuni\PowerBI\"

$blobName = "LiigaOdotMaalit.csv"

$localFile = $localFileDirectory + $blobName
Set-AzureStorageBlobContent -Force -File $localFile `

-Container $containerName `

-Blob $blobName `

-Context $ctx
That first part, profile loading, allows automated login into Azure. More info about that: http://www.smartcoding.in/blog/auto-login-azure-power-shell/.
Second which needed to be done was modifications to my current Machine Learning training model. I recommend making a copy and modifying that one. I added a Web service input and a Web service output. Web service input serves as an input for my new training data and Web service output serves as outputting the retrained model.

After running, training model needs to be also created as predictive model. Training model is used for retraining and after that, retrained model is published as predictive model. In other words, predictive model is updated. To be able to do that, an additional end point needs to added to predictive experiment:

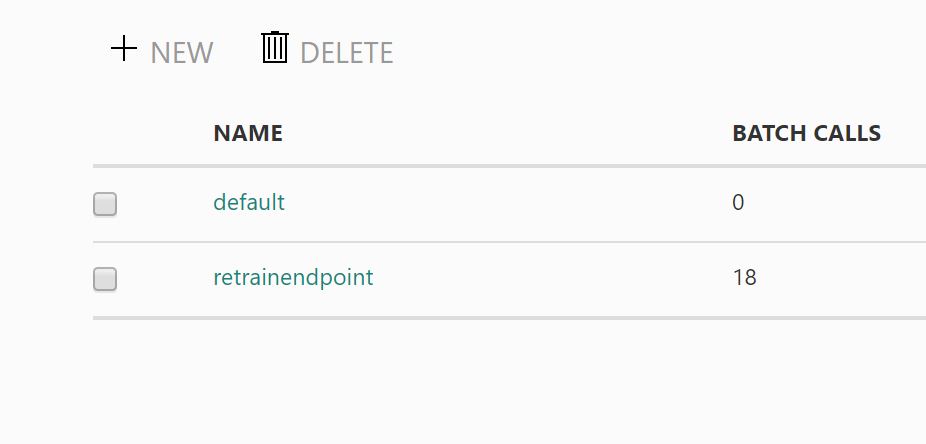
That new endpoint is used from now on as a service, which is called to make new predictions.
Ok, next the retraining with Azure Logic App, which consists of three parts: 1. Start 2. Retraining 3. Deploying new model.


Detailed instructions can be found from the link I provided at the top of this page.
Retraining done, next utilization. I create a csv-file for today’s games and send that also to Azure Blob Storage. I read game schedule from web site with Power BI, actually twice, because I need again two rows per game – one for the home team and one for the away team. To combine results I create additional table using DAX UNION and SELECTCOLUMNS – Otteluohjelma = UNION(SELECTCOLUMNS(Otteluohjelma_koti; ”Column1”;[Column1]; ”Pvm”; [Pvm];… In addition I format date field to format accepted by my model: Pvm2 = FORMAT(Otteluohjelma_koti[Pvm]; ”YYYY-MM-DDTHH:MM:SSZ”).
I use a pretty long R code to do my predictions. I do not attach it to here, because luckily you can get the code template from Azure ML Studio (well done Microsoft ML team!). You select your new web service predictive model end point, select ”Consume” from top, select ”Batch” from sample code sections and then you can select do you want your sample code in C#, Python or R. That sample code requires only small modifications.
At the end, job creates a file first to Azure Blob Storage, which is then downloaded automatically into my hard drive. That file I read into Power BI and it looks like this:
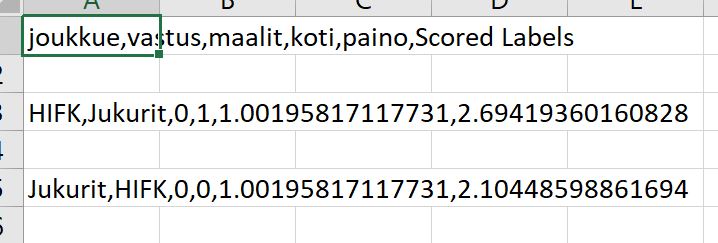
So each game is scored twice, once from each team’s viewpoint. Apparently this file requires a little bit modification. I remove blank rows and use DAX to give me opponent’s scores: VierasScore = IF(’3_Kierroksen_ennusteet'[koti] = 1; LOOKUPVALUE(’3_Kierroksen_ennusteet'[Scored Labels]; ’3_Kierroksen_ennusteet'[joukkue]; ’3_Kierroksen_ennusteet'[vastus])). End result is again showing each game only once:

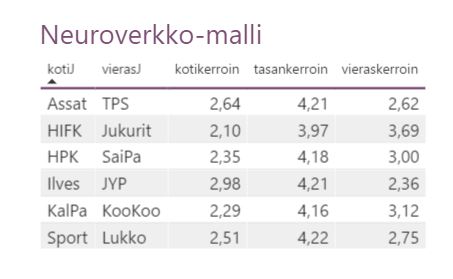
Score indicates predicted goals by each team playing against each other. But this needs to be transferred as probability predictions – home win, tie, away win. I use R and Poisson distribution to accomplish that.
I save that report as file. Then I create R matrix from goals from 0 to 9 and divide that into three parts – upper triangle, diagonal and lower triangle. From these three sets I get probabilities for each different outcome summing these three parts, but I need to adjust tie probability, because it gave too small values. I use handy for loop to do the same for each game in file.
setwd("C:\\Users\\terok\\OneDrive\\Duuni\\PowerBI")
tuloksetVoittaja <- read.csv("Liiga Voittaja Predictive.csv", header=TRUE, sep=";", encoding="UTF-8")
# This function just splits a data.frame to a list of rows. Then you can make a normal "for" over this list:
rows = function(tab) lapply(

seq_len(nrow(tab)),

function(i) unclass(tab[i,,drop=F])

)
output = NULL
for (ottelu in rows(tuloksetVoittaja)) {

m <- dpois(0:9, ottelu$KotiScore) %o% dpois(0:9, ottelu$VierasScore)

rownames(m) <- 0:9

colnames(m) <- 0:9
tasan <- sum(diag(m))

vieras <- sum(m[upper.tri(m)])

koti <- sum(m[lower.tri(m)])
kotikerroin <- 100/(koti*100-3)

tasankerroin <- 100/(tasan*100+6)

vieraskerroin <- 100/(vieras*100-3)
kotiJ <- ottelu$KotiJ

vierasJ <- ottelu$VierasJ
print(paste(kotiJ, vierasJ, kotikerroin, tasankerroin, vieraskerroin, sep=","))

output = rbind(output, data.frame(kotiJ, vierasJ, kotikerroin, tasankerroin, vieraskerroin))

}
Output is a data frame and because I execute this from Power BI, I get the results directly back. Finally we are ready with end results :). Huh, not so easy implementation, but now I feel like a winner!
I’m getting back to this my blog and how it performed in real life. I used my model in just season 2018-19 and here are the results.
I used a betting company, which payback percent was normally 92,5. In other words, if you would bet 100 € equally distributed to all three options (home win, tie, away win), you would get back 92,5 €. I invested in the beginning 100 € and played with 5 € stakes. Calculatory result should have been empty wallet after 258 games.
I played app. 360 games and at the end of the season my wallet had 164 €. Calculatory result should have been – 38 €.
So in a nutshell where I should have lost 138 €, I had won 60
€! I would say my machine learning model worked very well!